| Fightertown XC Invitational Boys Varsity | ||
| Teams | Athlete Placements | Team Score |
|---|---|---|
| Croatan | 1, 4, 8, 23, 59, 60, 62 | 95 |
| West Carteret | 15, 17, 21, 22, 31, 34, 39 | 106 |
| Lejeune | 2, 5, 12, 33, 57, 66, 79 | 109 |
| Swansboro | 3, 7, 9, 29, 73 | 121 |
| Terra Ceia Christian School | 16, 19, 20, 44, 47, 50, 93 | 146 |
| Pamlico County | 11, 18, 41, 49, 52, 54, 77 | 171 |
| White Oak | 14, 30, 32, 45, 72, 89, 91 | 193 |
| Havelock | 6, 35, 38, 53, 71, 85, 95 | 203 |
| South Lenoir | 36, 40, 42, 48, 58, 68, 70 | 224 |
| Wilson Christian Academy | 10, 28, 46, 63, 84, 94 | 231 |
| Jacksonville | 24, 25, 51, 64, 75, 76 | 239 |
| D.H. Conley | 27, 55, 56, 61, 67, 82, 83 | 266 |
| Heide Trask | 26, 43, 74, 88, 92, 98 | 323 |
| Rocky Mount High School | 13, 69, 78, 81, 96, 101, 104 | 337 |
| Richlands | 37, 80, 97, 99, 100, 105 | 413 |
| Living Water Christian School | 65, 86, 87, 90, 102, 103, 106 | 430 |
It’s been a while since I’ve posted on this portion of my blog. I’ve been getting geared up for my sons’ upcoming Cross Country seasons. As a former NCAA athlete in this sport (not good enough for a scholarship), I get very fired up this time of year. So I’ve been scraping some results from Milesplit and visualizing the team results.
Cross Country Scoring Primer
Cross country races are scored as follows. Each team can have up to 7 athletes for scoring purposes. The team score is found by adding up the places of the top 5 athletes from each team. Low score wins. Teams that have 5 or 6 athletes will also receive scores.
The best possible Cross Country score is \(1+2+3+4+5=15\) points. A shut-out is when all 7 athletes from one team finish before the first athlete from the second team. In a dual meet (where there are only two teams) this results in a 15-50 score.
If two teams are tied, the tie is broken by the 6th and 7th athletes. (Fun fact, my senior year of high school, the team that won did so on this tie breaker. The 3rd place team was one point behind them. It was an incredibly tight race!)
This is the team score from the Fightertown Invitational where my son set a new PR!
 datawolf04
  wolf-253b6625a
This is all well and good, and there are some string formatting things I could probably do. But this isn’t very visual. And I like making visualizations.
Some visualizations that I’ve been testing out.
It’s neat to see how the teams stack up. So the first visualization represents each athlete with a dot and each team with a color/row. This visualization includes all athletes in the race, even those that didn’t contribute to the team scoring. I like it because you can see where the athletes are grouped together. Indeed, many cross country coaches encourage their teams to run as a pack for scoring purposes as well as teamwork purposes.
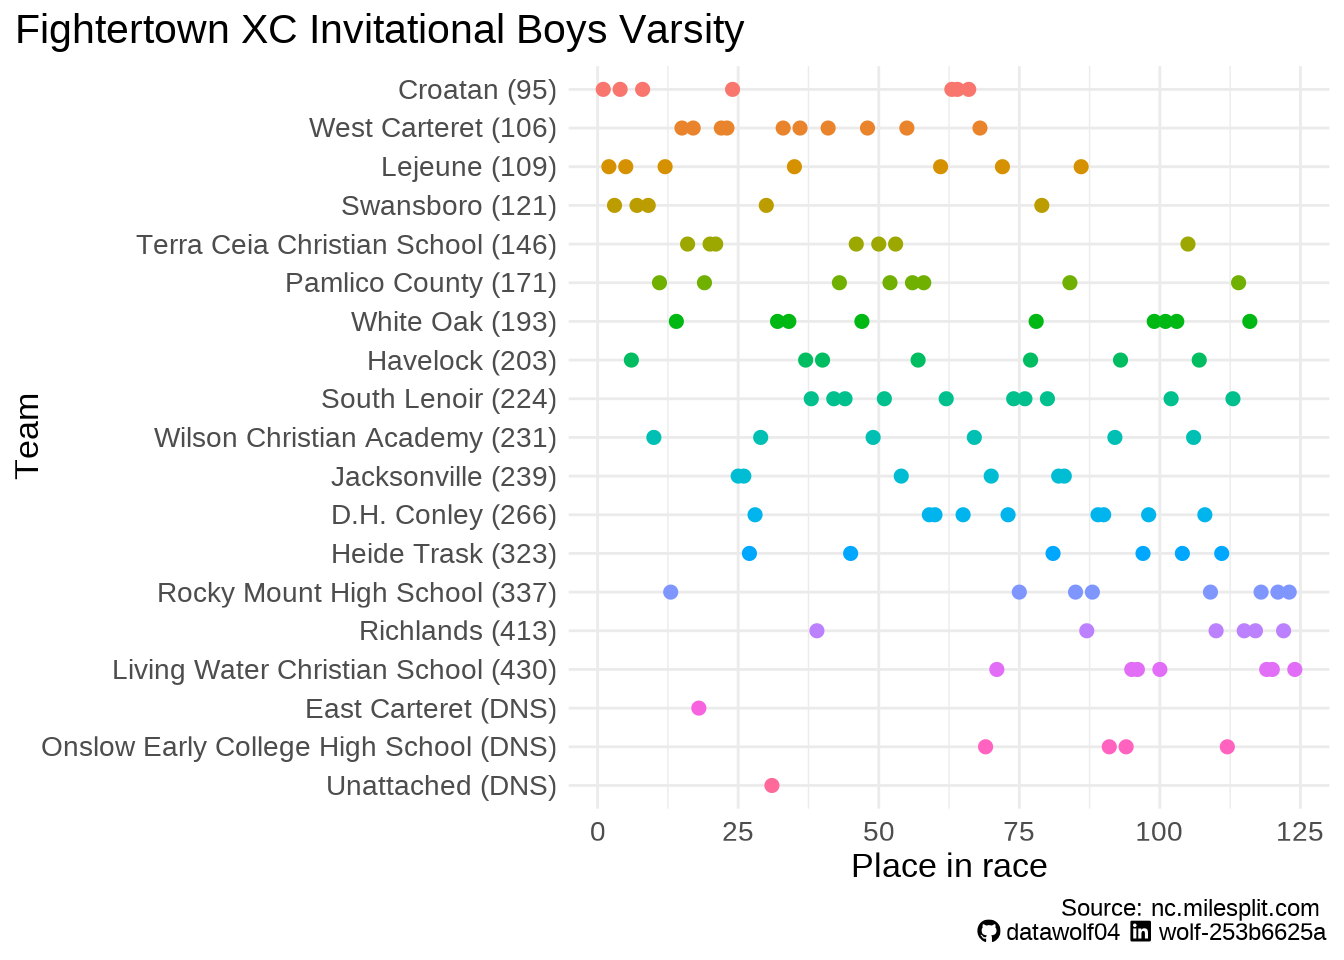
One limitation with the above visualization is that the values on the x-axis are simply the place in the race. In the parlance of statistics, this is called ordinal data. So this means that the values are ordered (2nd place is before 3rd place), but it doesn’t tell us anything about the gap between the runners. It could have been 20 seconds, 2 seconds, or even 0.2 seconds. So in the figure below, I’m using the time instead of the place on the x-axis, changing how the dots are bunched together.
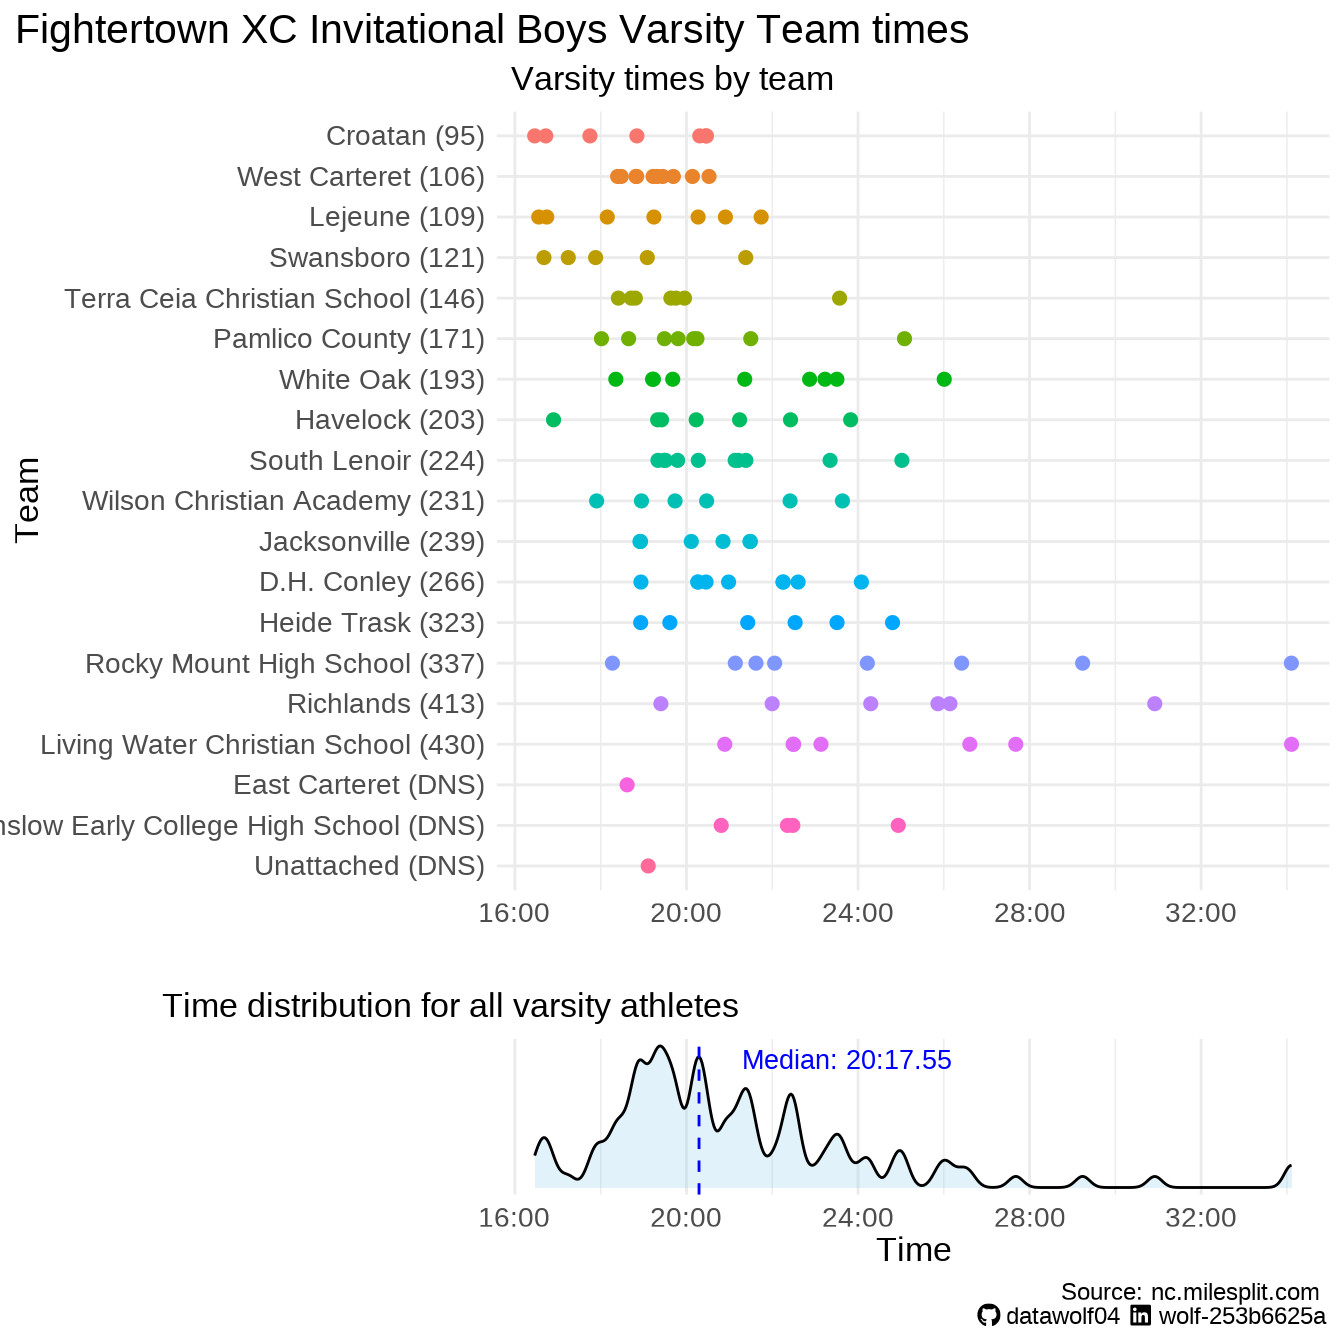
One other benefit of this is that we can see the distribution of times in the race. The bottom figure is a density plot as if the dots in the top portion of the plot were binned and turned into a histogram, and then smoothed out. (For the nerdy: this is called Kernel Density Estimation.)
Neither of these visualizations are standard in the Cross Country result reporting space. But they help me “see” what went on, even though I was there. And I could see talking about improvement and other things with an athlete using these plots as a starting point.