library(tidyverse)
library(gt)
library(rworldmap)
library(paletteer)
library(RColorBrewer)

load('worldsFairs.Rdata')
source('helperFunctions.R')This week’s #TidyTuesday is all about World’s Fairs, and I have always wanted to figure out how to make a visualization with a map. So this is the week that I try that out. In addition to the data from Wikipedia in the given dataset, I have also downloaded S. Altan’s Kaggle Dataset: Countries by Continent.
Plan and data cleaning
My plan is to create visualizations that look at different world’s fair properties by continent and country. I will clean the data a bit, and then generate some tables.
Continental breakdown of World’s fair
fairData = left_join(worlds_fairs,countryContinent, by='country')

# Replace missing continents by hand
missing = c("Europe","Oceania","Europe","Europe","Asia")
fairData$continent[is.na(fairData$continent)] = missing

fairDataByContinent = fairData |>
  mutate(
    duration = calcFLMV(start_month, start_year, end_month, end_year)
  ) |> group_by(continent) |>
  summarize(
    N = n(),
    across(where(is.numeric), ~ mean(.x,na.rm=TRUE))
  ) |>
select(-c('start_month','start_year','end_month','end_year'))| World's Fair by the numbers | ||||||
| Average properties by host continent | ||||||
| Continent | Number Hosted | Visitors (M) | Avg. cost (M$) | Land area (hectares) | Number of attending countries | Fair duration (mo) |
|---|---|---|---|---|---|---|
| Asia | 11 | 26.0 | 1,999.7 | 169.4 | 103.5 | 5.1 |
| Europe | 43 | 12.7 | 547.8 | 77.1 | 42.7 | 5.2 |
| North America | 14 | 20.9 | 281.4 | 144.2 | 29.8 | 8.9 |
| Oceania | 2 | 9.9 | 320.5 | 32.5 | 34.5 | 7.0 |
#TidyTuesday • Sources: Wikipedia and S. Altan Kaggle dataset |
||||||
| Missing data was ignored from averages taken. | ||||||
Country breakdown of world’s fair
fairDataByCountry = fairData |>
  mutate(
    duration = calcFLMV(start_month, start_year, end_month, end_year)
  ) |> group_by(country) |>
  summarize(
    N = n(),
    across(where(is.numeric), ~ mean(.x,na.rm=TRUE))
  ) |>
select(-c('start_month','start_year','end_month','end_year'))| World's Fair by the numbers | ||||||
| Average properties by host country | ||||||
| Country | Number Hosted | Visitors (M) | Fair cost (M$) | Land area (hectares) | Number of attending countries | Fair duration (mo) |
|---|---|---|---|---|---|---|
| Australia | 1 | 18.5 | 625.0 | 40.0 | 36.0 | 7.0 |
| Austria-Hungary | 1 | 7.2 | 95.0 | 233.0 | 35.0 | 6.0 |
| Belgium | 7 | 16.4 | 558.8 | 117.7 | 26.9 | 6.7 |
| Bulgaria | 3 | 1.0 | — | 5.8 | 40.5 | 1.7 |
| Canada | 2 | 36.2 | 371.0 | 217.5 | 58.5 | 6.5 |
| Colony of Victoria | 1 | 1.3 | 16.0 | 25.0 | 33.0 | 7.0 |
| Finland | 1 | — | — | 0.1 | 25.0 | 1.0 |
| France | 9 | 21.6 | 556.0 | 67.9 | 34.5 | 5.4 |
| Germany | 1 | 18.1 | 3,400.0 | 160.0 | 155.0 | 5.0 |
| Haiti | 1 | — | — | 24.0 | 15.0 | 7.0 |
| Hungary | 1 | 1.9 | — | 35.0 | 52.0 | 2.0 |
| Israel | 2 | — | — | 29.8 | 13.0 | 2.0 |
| Italy | 8 | 7.7 | 26.0 | 68.3 | 44.1 | 5.5 |
| Japan | 4 | 27.5 | 30.0 | 175.7 | 69.8 | 7.0 |
| Kazakhstan | 1 | 4.1 | — | 25.0 | 115.0 | 4.0 |
| People's Republic of China | 1 | 73.1 | 4,200.0 | 523.0 | 192.0 | 6.0 |
| Portugal | 1 | 10.1 | — | 50.0 | 143.0 | 5.0 |
| South Korea | 2 | 11.3 | 1,769.0 | 57.5 | 122.0 | 4.0 |
| Spain | 4 | 13.9 | 21.0 | 101.2 | 68.8 | 7.2 |
| Sweden | 3 | — | — | 0.5 | 18.3 | 2.3 |
| United Arab Emirates | 1 | 24.1 | — | 438.0 | 192.0 | 6.0 |
| United Kingdom | 2 | 6.0 | 83.5 | 12.5 | 32.0 | 7.0 |
| United States | 11 | 18.2 | 265.1 | 141.8 | 25.6 | 9.5 |
| West Germany | 2 | 2.1 | — | 51.6 | 24.5 | 4.0 |
#TidyTuesday • Sources: Wikipedia and S. Altan Kaggle dataset |
||||||
| Missing data was ignored from averages taken. Blank values imply no data exists for that country and quantity. | ||||||
Putting this on a map
worldFairMap <- joinCountryData2Map(fairDataByCountry, joinCode = 'NAME',
                                    nameJoinColumn = "country")
21 codes from your data successfully matched countries in the map
3 codes from your data failed to match with a country code in the map
222 codes from the map weren't represented in your datapar(mar=c(0,0.1,2,0.1),xaxs="i",yaxs="i",cex.main=2)
attendMap = mapCountryData(worldFairMap, addLegend=FALSE,
nameColumnToPlot = 'attending_countries',
catMethod = "pretty",
colourPalette = brewer.pal(10,"Purples"),
oceanCol='lightblue',missingCountryCol = 'white',
mapTitle="Country attendance")You asked for 7 categories, 10 were used due to pretty() classificationWarning in brewer.pal(10, "Purples"): n too large, allowed maximum for palette Purples is 9
Returning the palette you asked for with that many colorsWarning in rwmGetColours(colourPalette, numColours): 9 colours specified and 10
required, using interpolation to calculate coloursdo.call(addMapLegend, c(attendMap, legendWidth=0.5, legendMar=5))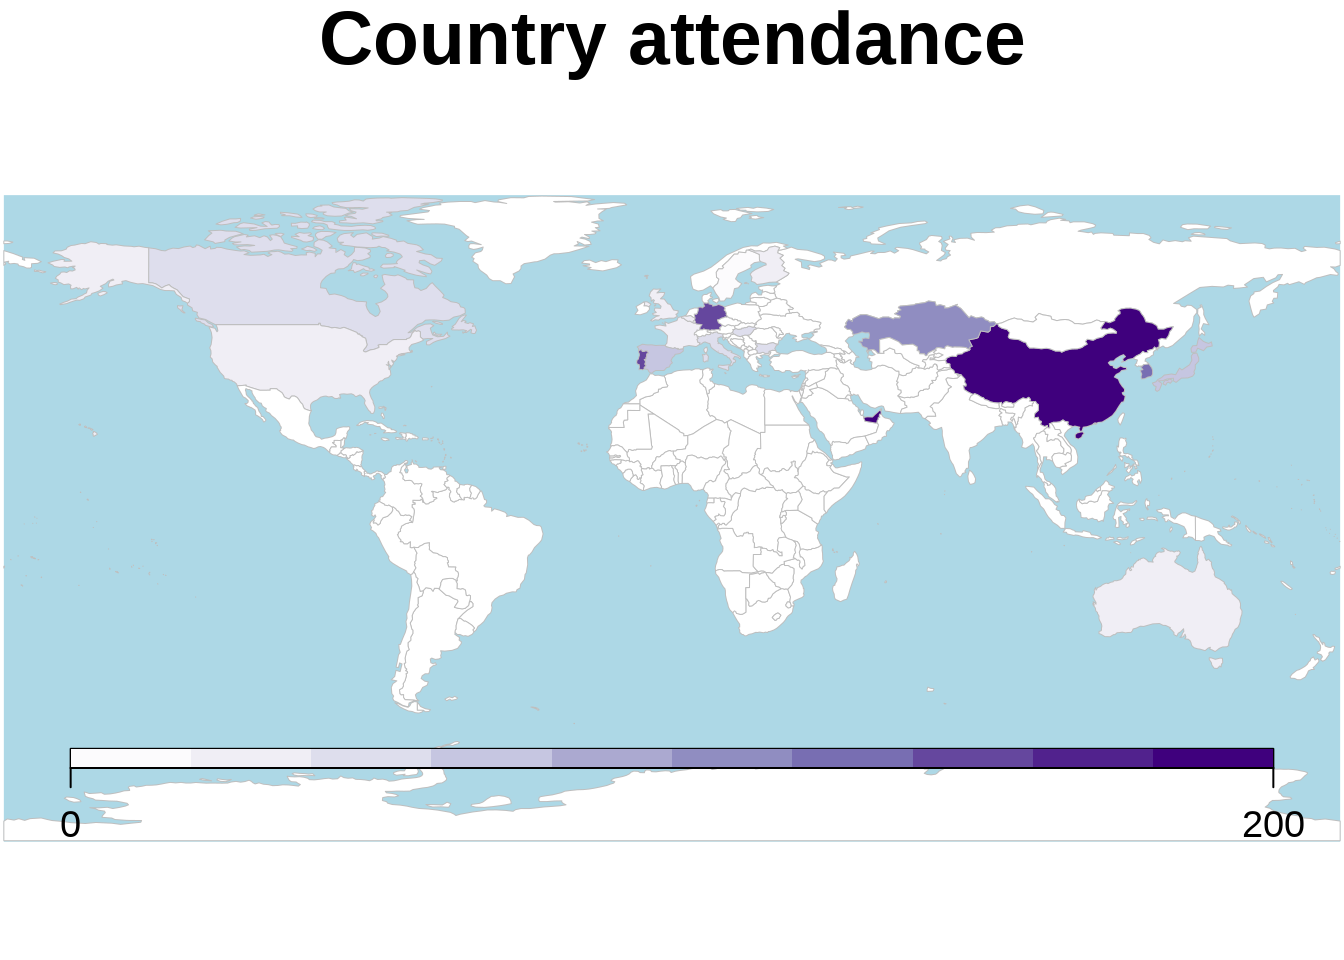
costMap = mapCountryData(worldFairMap, nameColumnToPlot = 'cost',
               catMethod = "pretty", addLegend=FALSE,
               colourPalette = brewer.pal(10,"Greens"),
               oceanCol='lightblue',missingCountryCol = 'white',
               mapTitle="Cost in Millions")
You asked for 7 categories, 9 were used due to pretty() classificationWarning in brewer.pal(10, "Greens"): n too large, allowed maximum for palette Greens is 9
Returning the palette you asked for with that many colorsdo.call(addMapLegend, c(costMap, legendWidth=0.5, legendMar=5))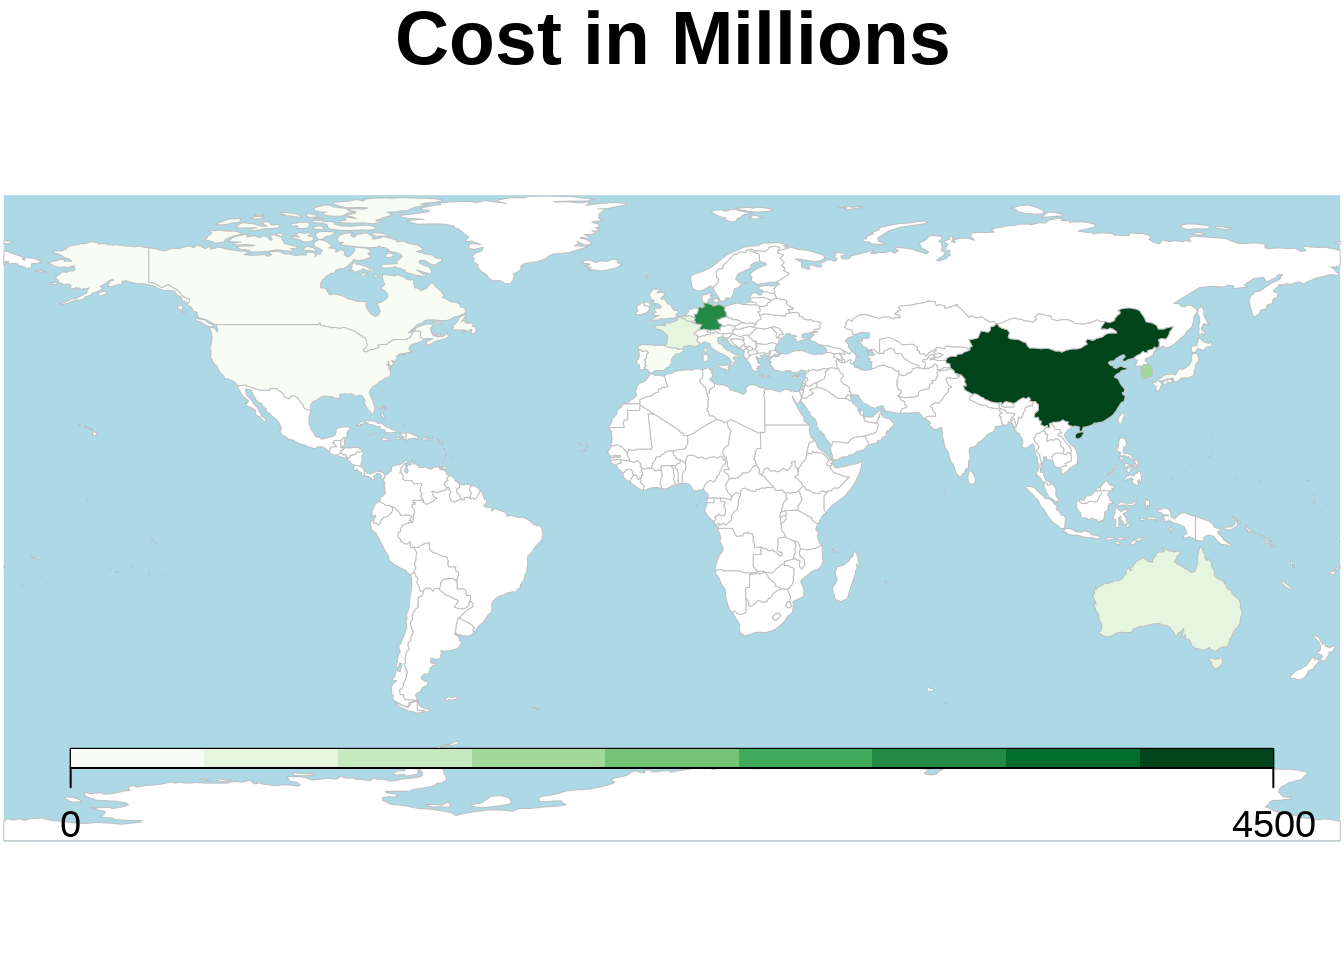
areaMap = mapCountryData(worldFairMap, nameColumnToPlot = 'area',
               catMethod = "pretty", addLegend=FALSE,
               colourPalette = brewer.pal(10,"PuBuGn"),
               oceanCol='lightblue',missingCountryCol = 'white',
               mapTitle="Size of fairgrounds")
You asked for 7 categories, 6 were used due to pretty() classificationWarning in brewer.pal(10, "PuBuGn"): n too large, allowed maximum for palette PuBuGn is 9
Returning the palette you asked for with that many colorsWarning in rwmGetColours(colourPalette, numColours): 9 colours specified and 6
required, using interpolation to calculate coloursdo.call(addMapLegend, c(areaMap, legendWidth=0.5, legendMar=5))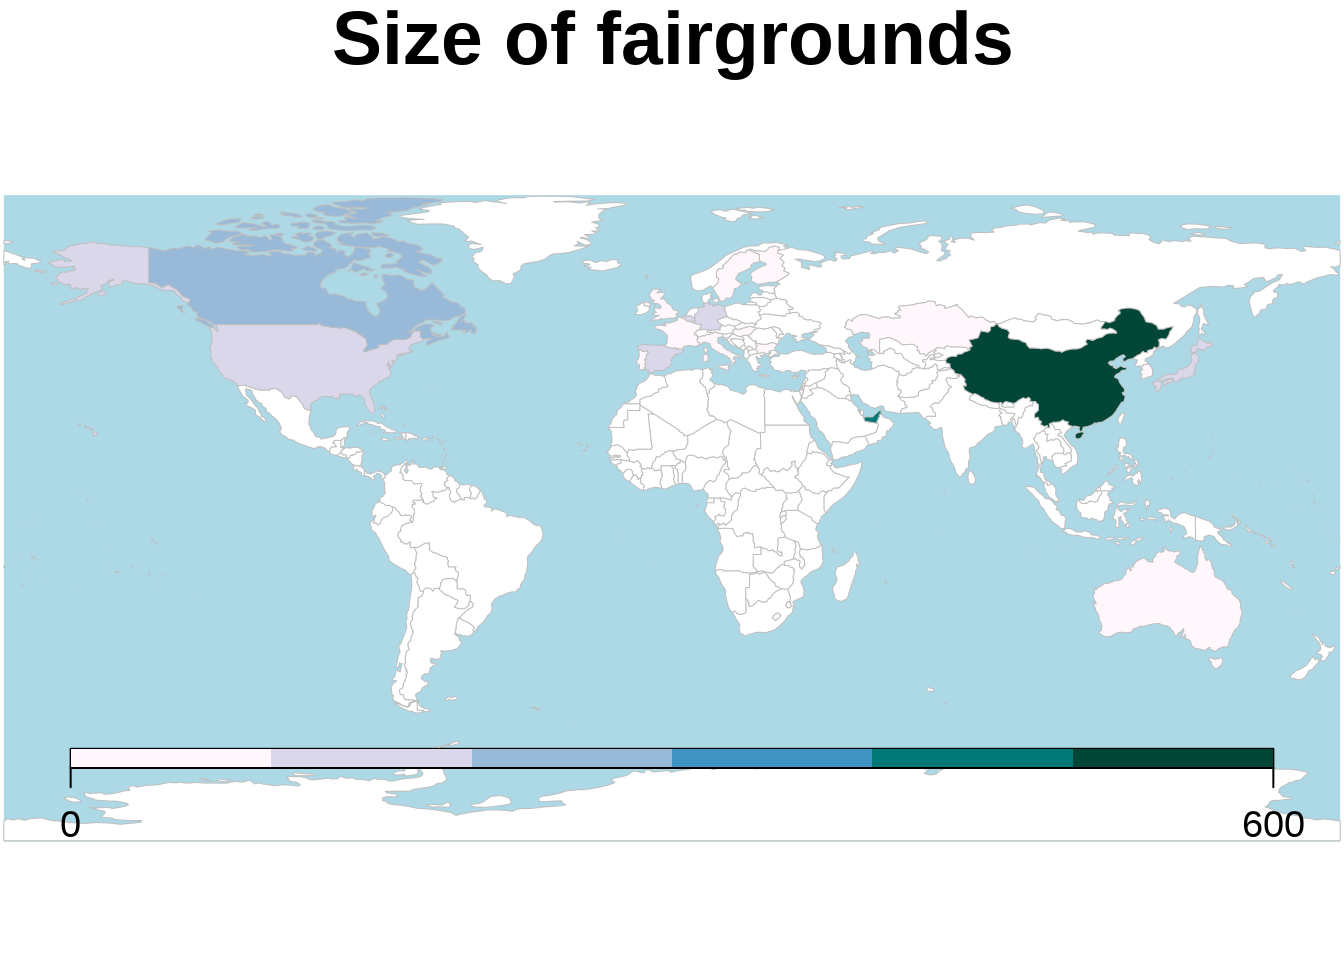
visitMap = mapCountryData(worldFairMap, nameColumnToPlot = 'visitors',
               catMethod = "pretty", addLegend=FALSE,
               colourPalette = brewer.pal(10,"OrRd"),
               oceanCol='lightblue',missingCountryCol = 'white',
               mapTitle="Fair Visitors by the Million")
You asked for 7 categories, 8 were used due to pretty() classificationWarning in brewer.pal(10, "OrRd"): n too large, allowed maximum for palette OrRd is 9
Returning the palette you asked for with that many colorsWarning in rwmGetColours(colourPalette, numColours): 9 colours specified and 8
required, using interpolation to calculate coloursdo.call(addMapLegend, c(visitMap, legendWidth=0.5, legendMar=5))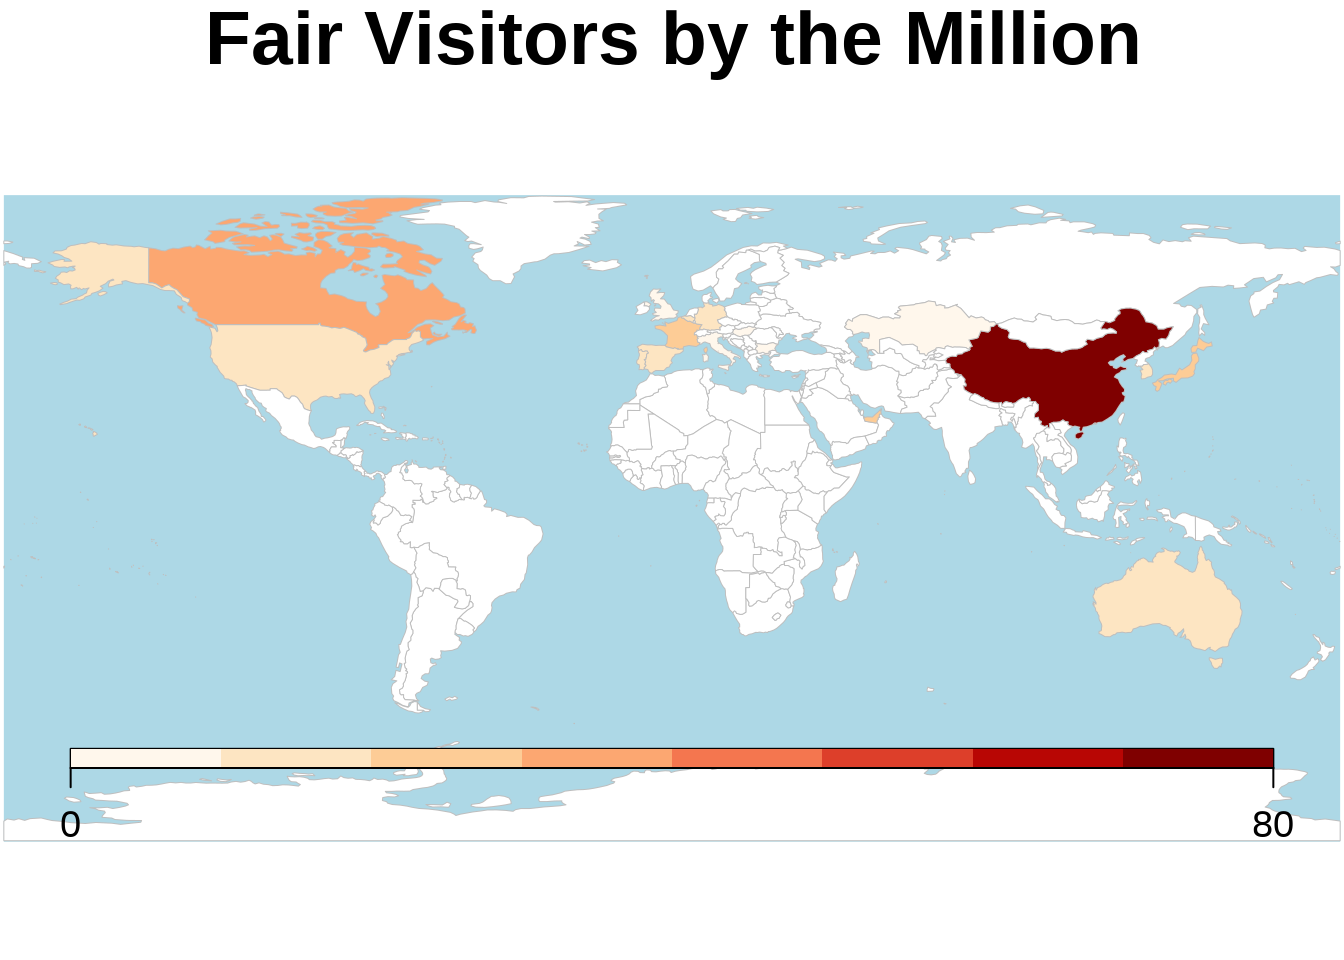
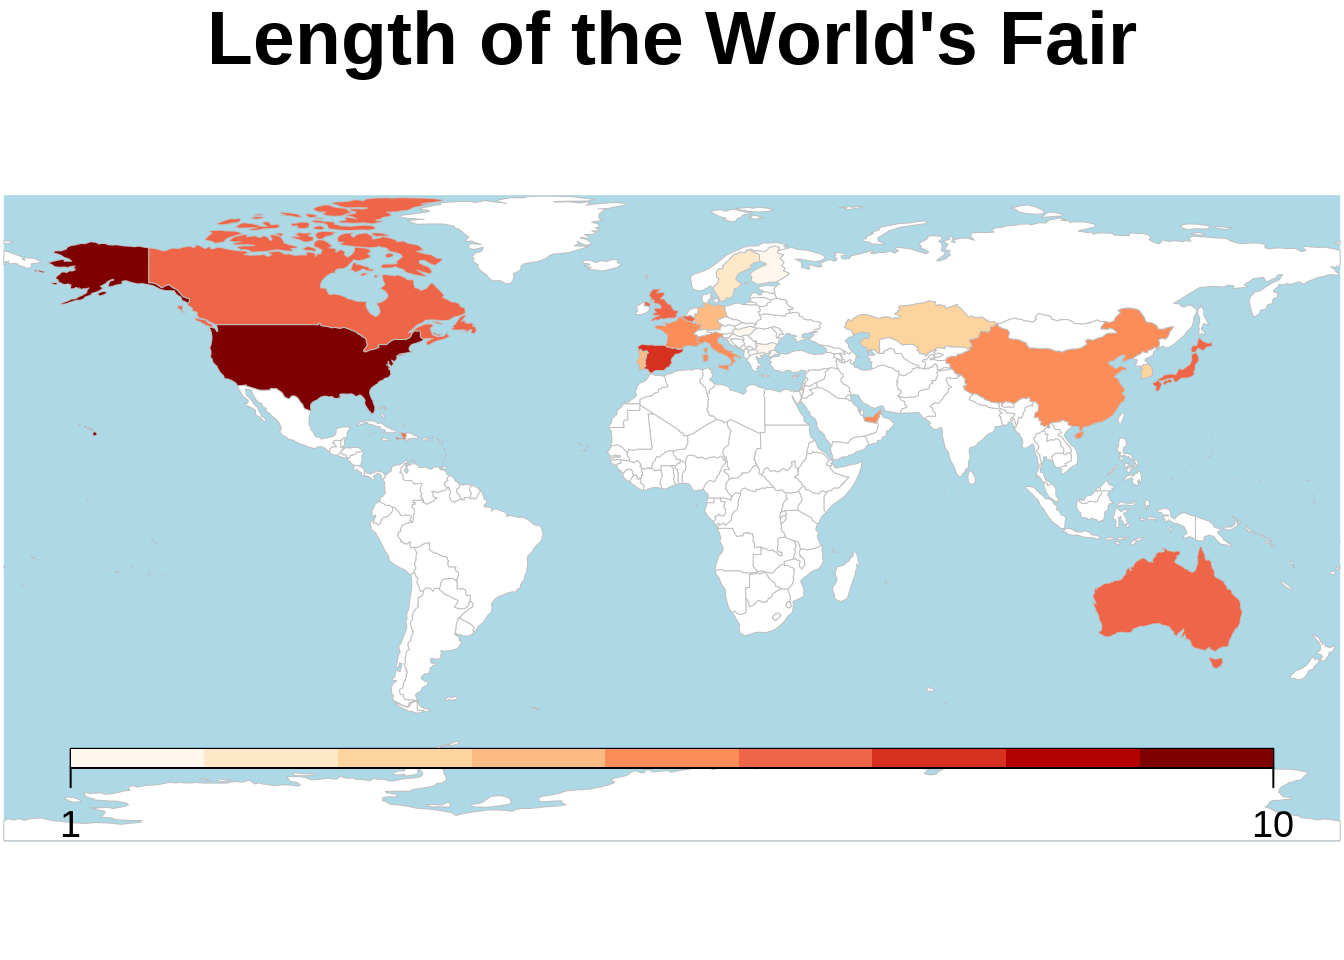
timeMap = mapCountryData(worldFairMap, nameColumnToPlot = 'duration',
               catMethod = "pretty", addLegend=FALSE,
               colourPalette = brewer.pal(10,"OrRd"),
               oceanCol='lightblue',missingCountryCol = 'white',
               mapTitle="Length of the World's Fair")
You asked for 7 categories, 9 were used due to pretty() classificationWarning in brewer.pal(10, "OrRd"): n too large, allowed maximum for palette OrRd is 9
Returning the palette you asked for with that many colorsdo.call(addMapLegend, c(timeMap, legendWidth=0.5, legendMar=5))