load("soSurvey.RData")
source('helperFunctions.R')
library(tidyverse)
library(paletteer)

personalDataCats = c('main_branch','age','remote_work','ed_level','years_code',
                     'years_code_pro','dev_type','org_size','country','currency',
                     'comp_total')

personData <- stackoverflow_survey_single_response |>
  select(all_of(personalDataCats)) |>
  filter(!is.na(remote_work))

cwRemote = qname_levels_single_response_crosswalk |>
  filter(qname=='remote_work')

cwRemote$label = c("Hybrid","In-person","Remote")
remoteLevels = c("In-person","Hybrid","Remote")

personData <- left_join(personData,cwRemote,by=join_by(remote_work == level)) |>
  mutate(remote_work = factor(label,levels=remoteLevels)) |>
select(!qname & !label)This week’s dataset is derived from the 2024 Stack Overflow Annual Developer Survey. Conducted in May 2024, the survey gathered responses from over 65,000 developers.
Given that one of the big trends being discussed in the world right now is working from home vs. going back to the office, I was wondering if there were any trends in this data as to who is working at home. Note, that this dataset did not include gender or race data. In particular, I’m considering 3 questions:
- Does education level matter?
- Does age matter?
- Does experience/expertise matter?
Work type and education level
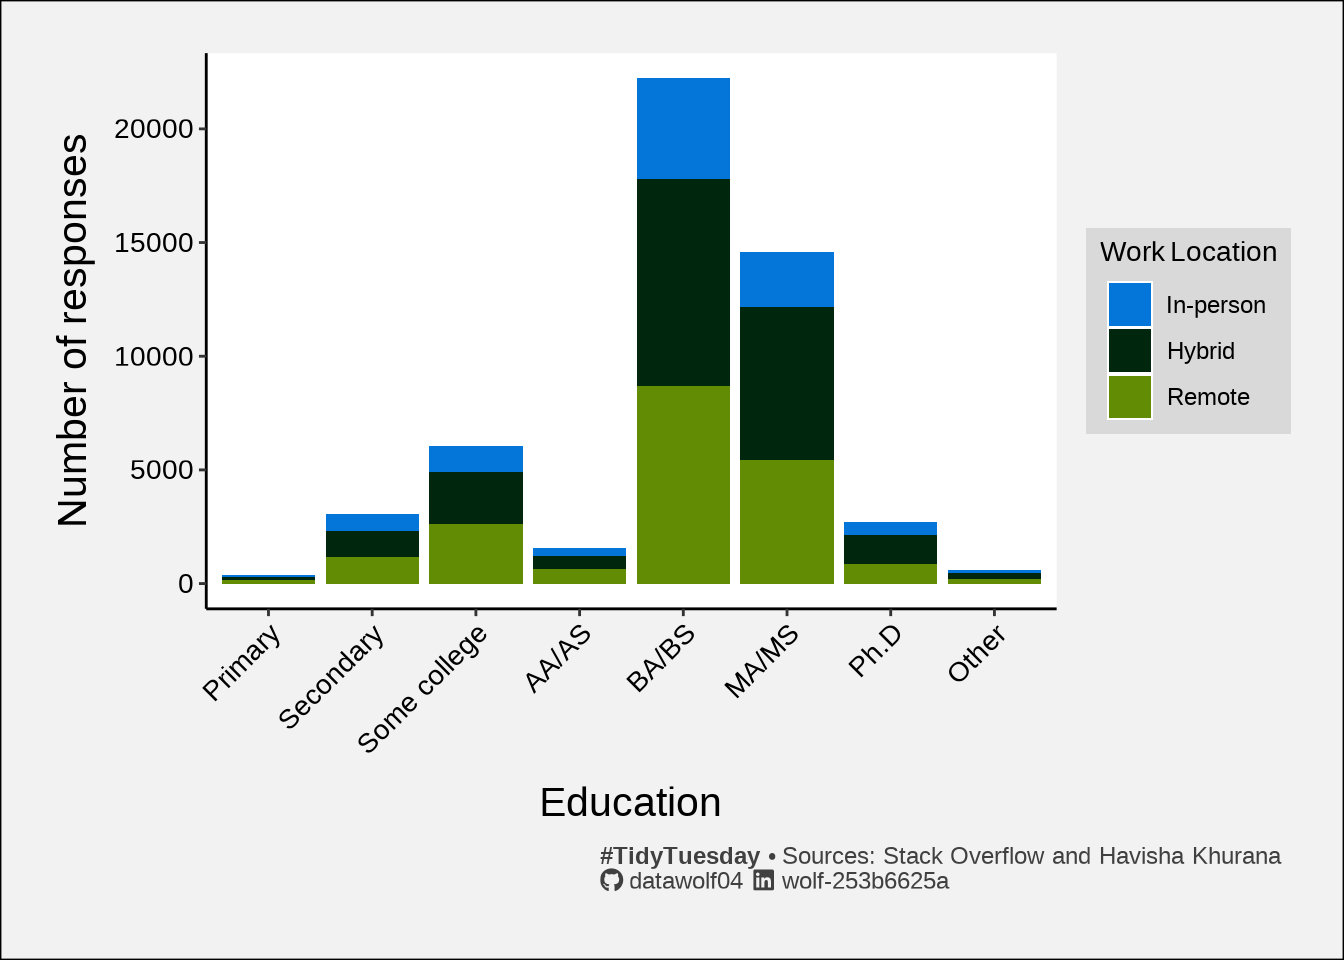
This graph shows the number of responses as well as the level of education that each user has. We can see that most users of Stack Overflow have at least 4-year college degree. This would seem to be in line with the general profile of someone working in a STEM field. It is somewhat difficult to glean what, if any, role there is between work location and education level.
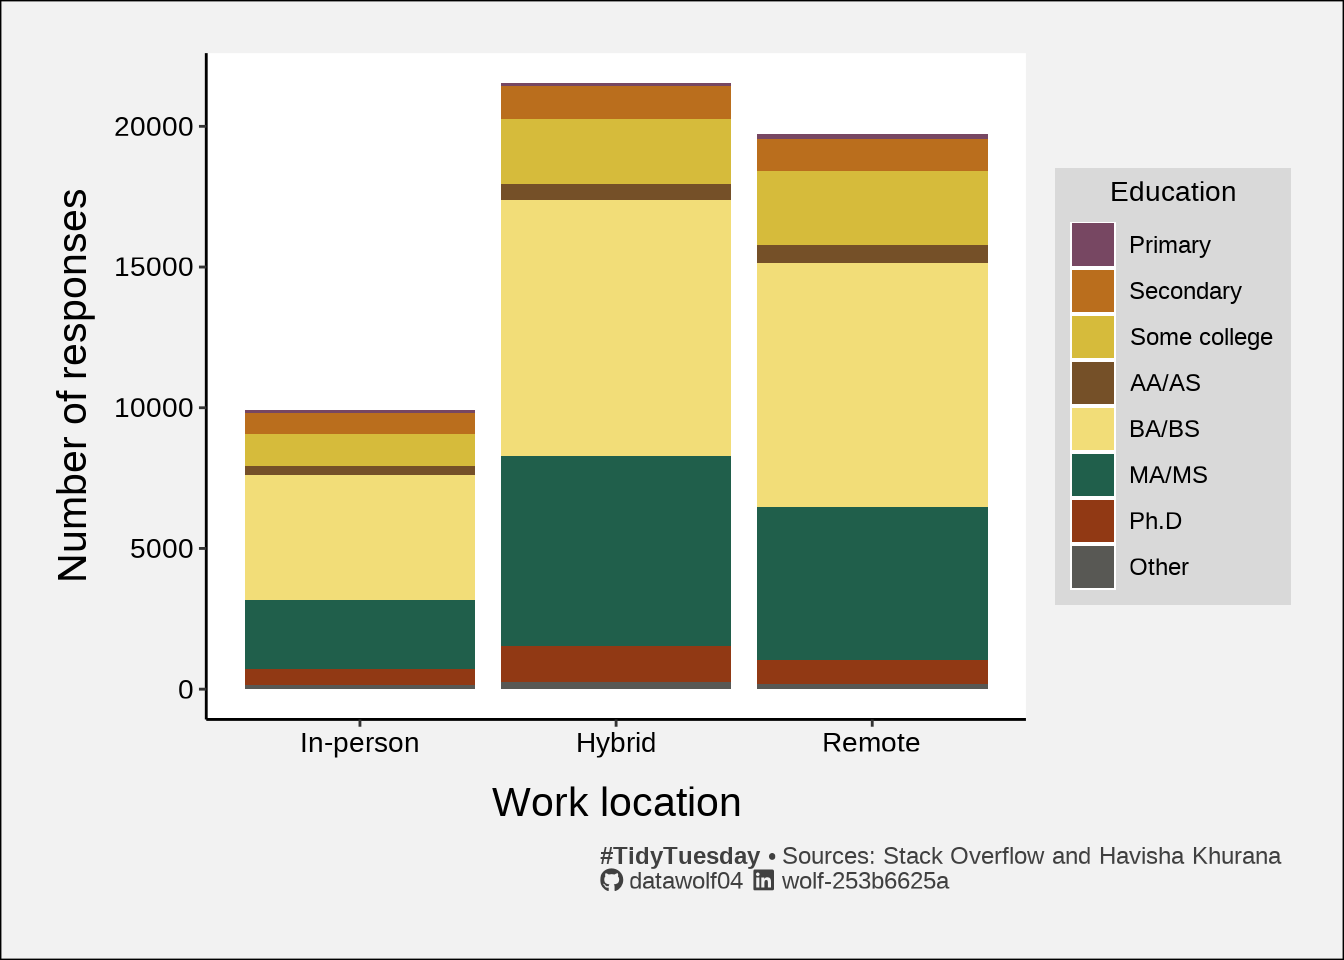
Next, we consider the same data, but we are highlighting the counts based on work location. This plot shows that a large fraction of Stack Overflow users are working in hybrid or remote locations.
In the following two plots, I’ll show the same information as above, except as percentages rather than raw counts.
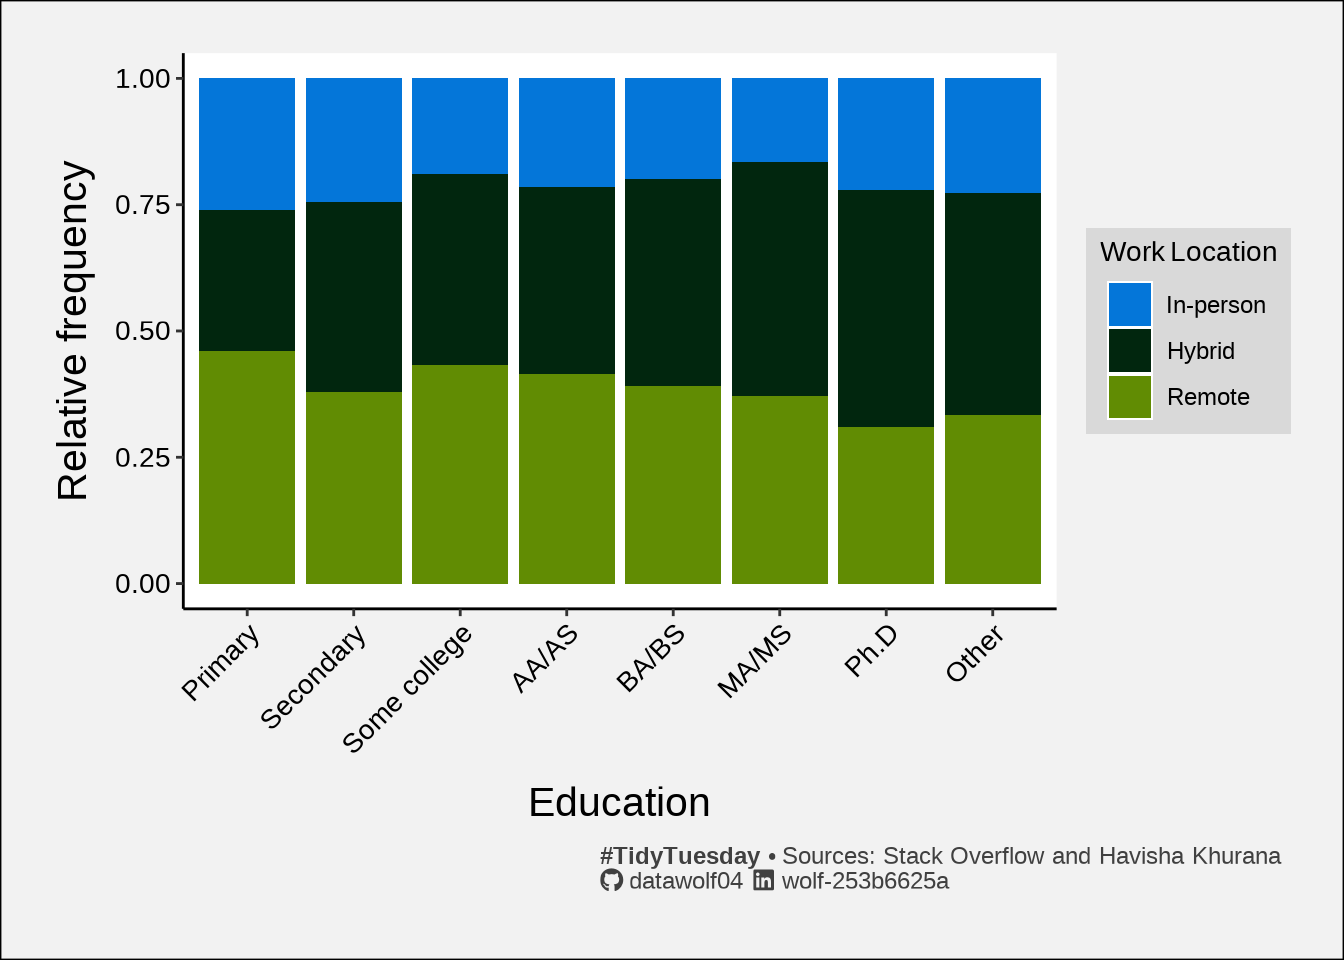
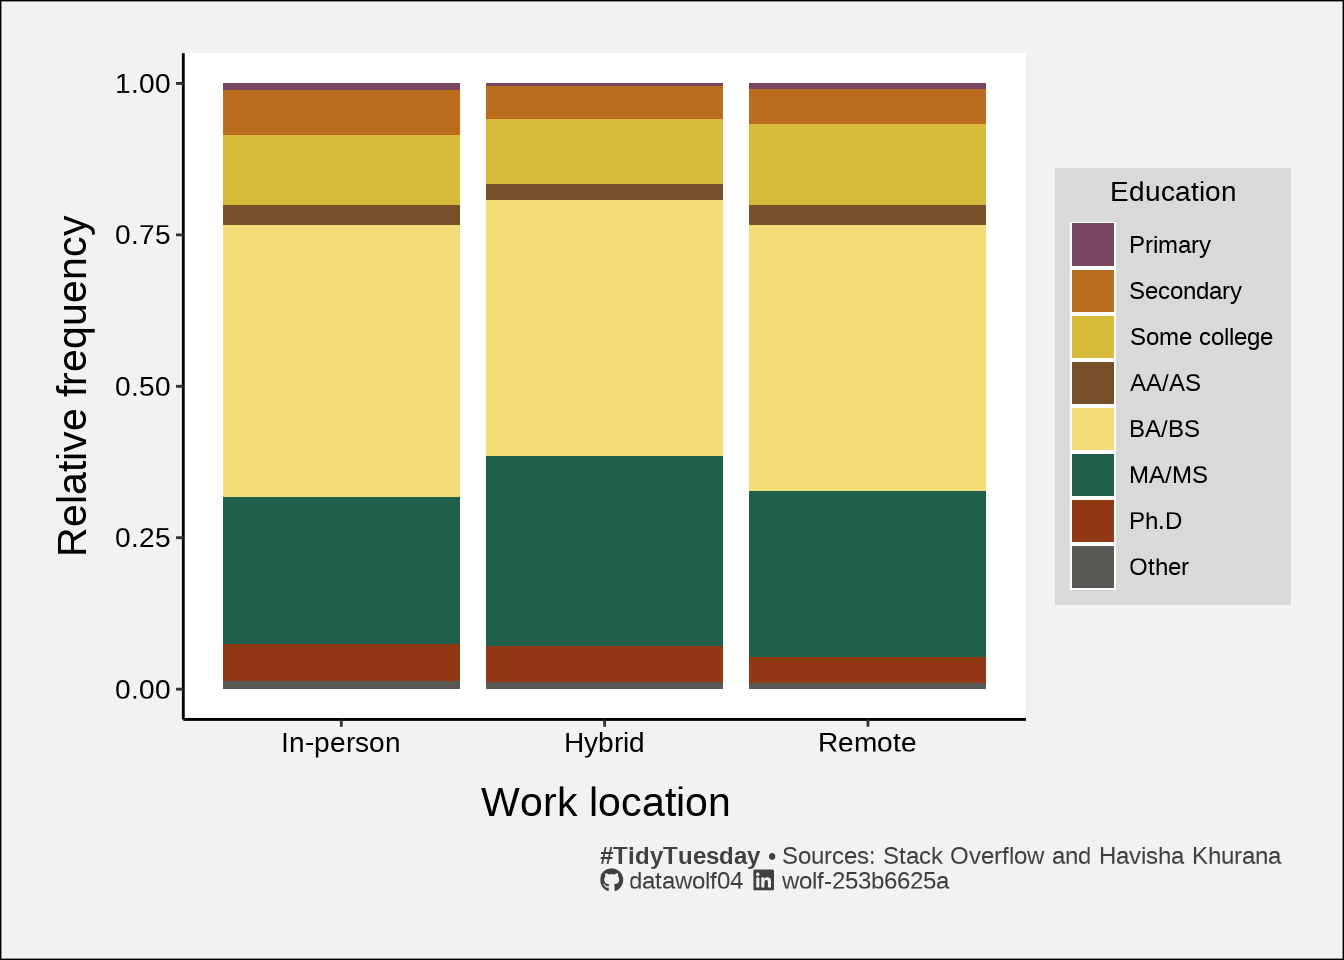
Neither of these suggests that education level would predict work location for stack overflow users.
Work type and age
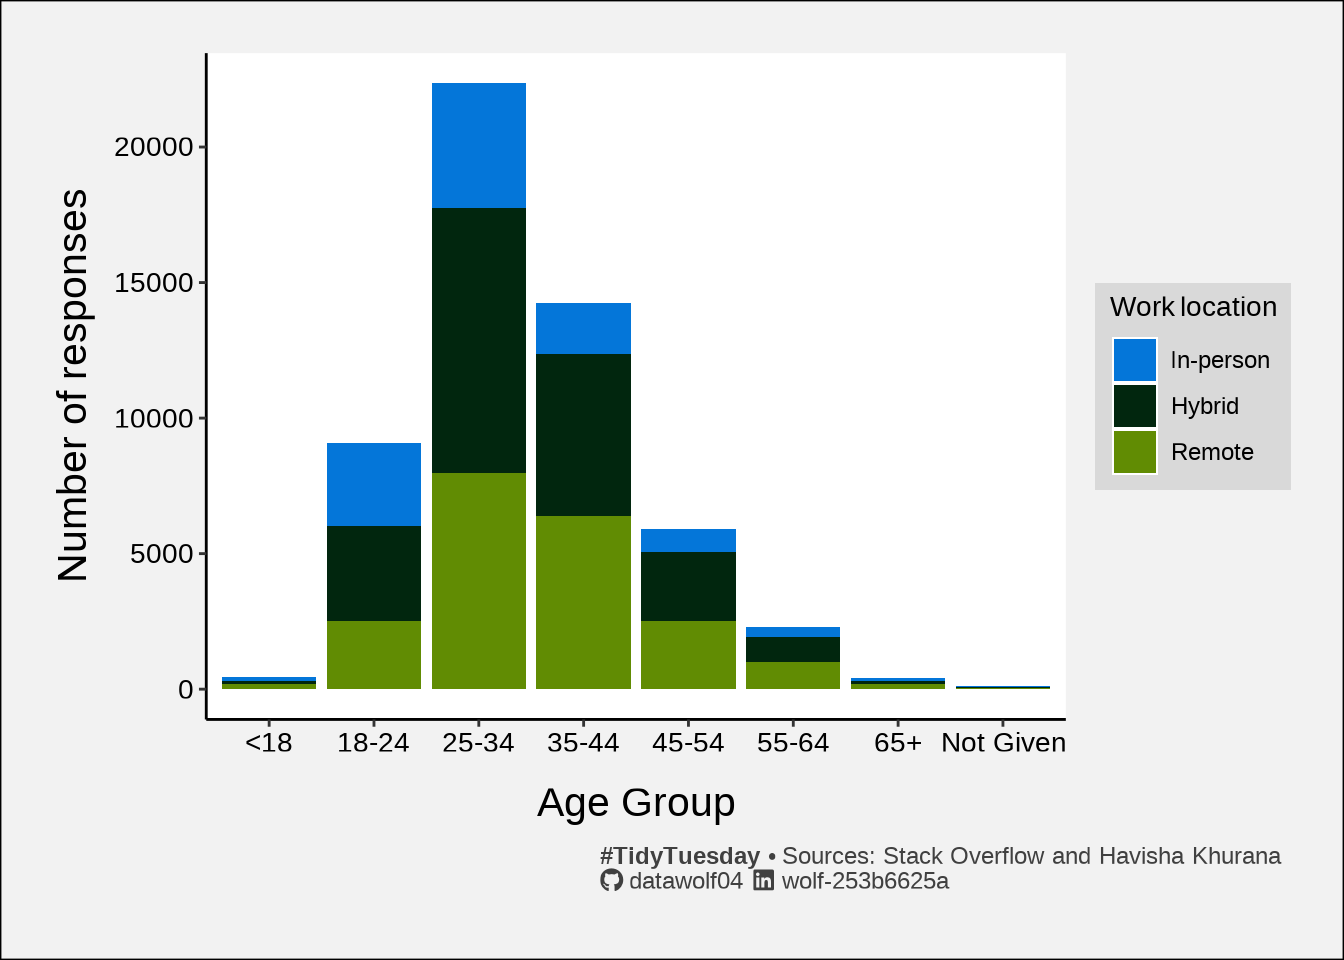
The above plot looks at the number of responses by age. We can see clearly that most users are between ages 25 and 44.
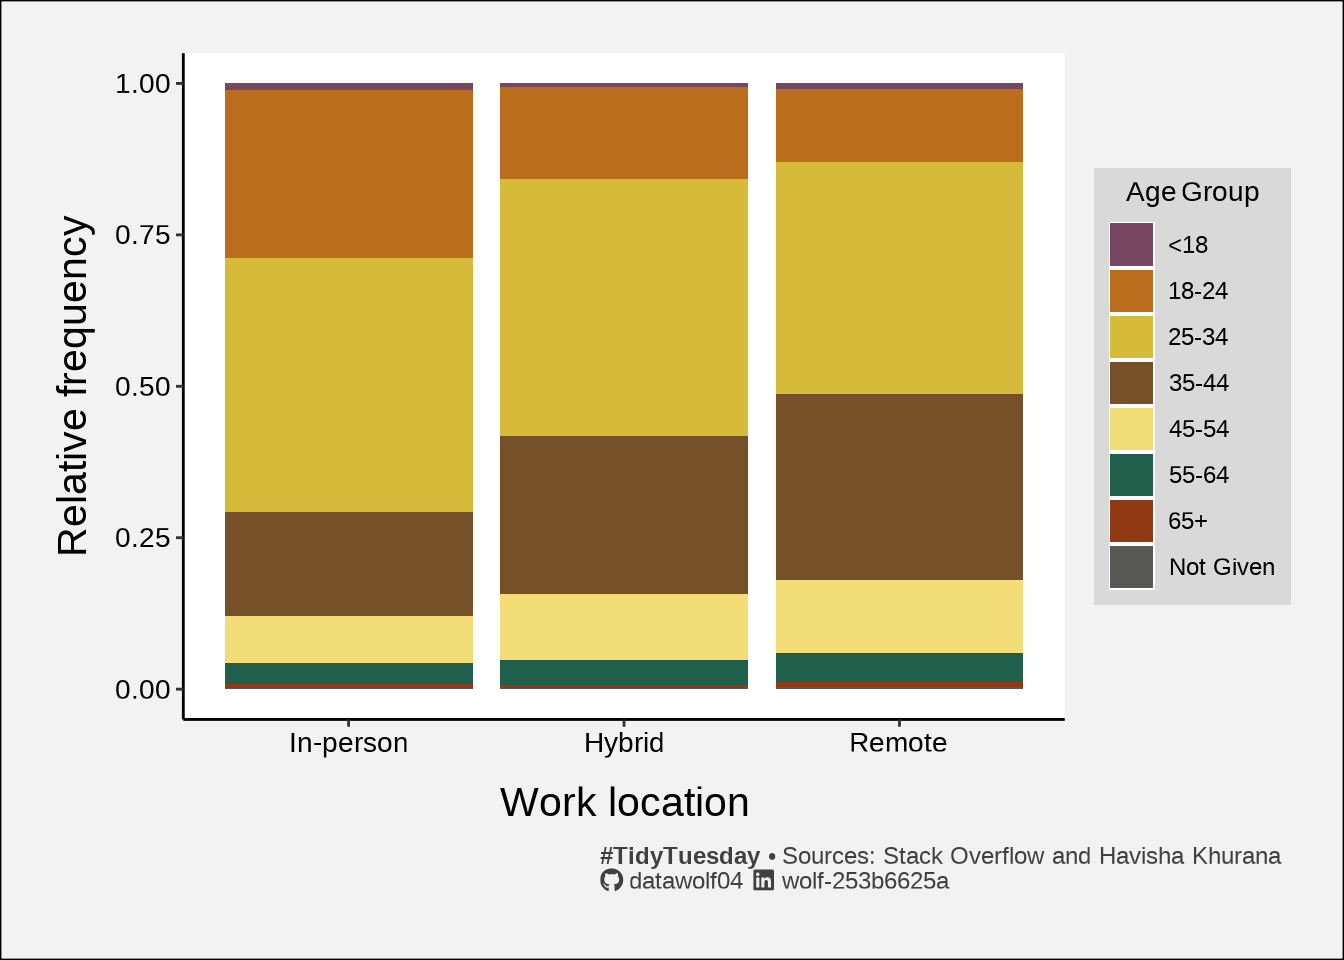
Here we see that the age group from 18-24 is working in-person much more than they work hybrid/remote. As this group is college-aged, and most colleges and universities are back to in-person instruction, this could suggest that students who are learning to code at university are using Stack Overflow for help (as this college professor hopes they would). As users age, they tend to find more hybrid/remote roles.
Work type and Experience coding
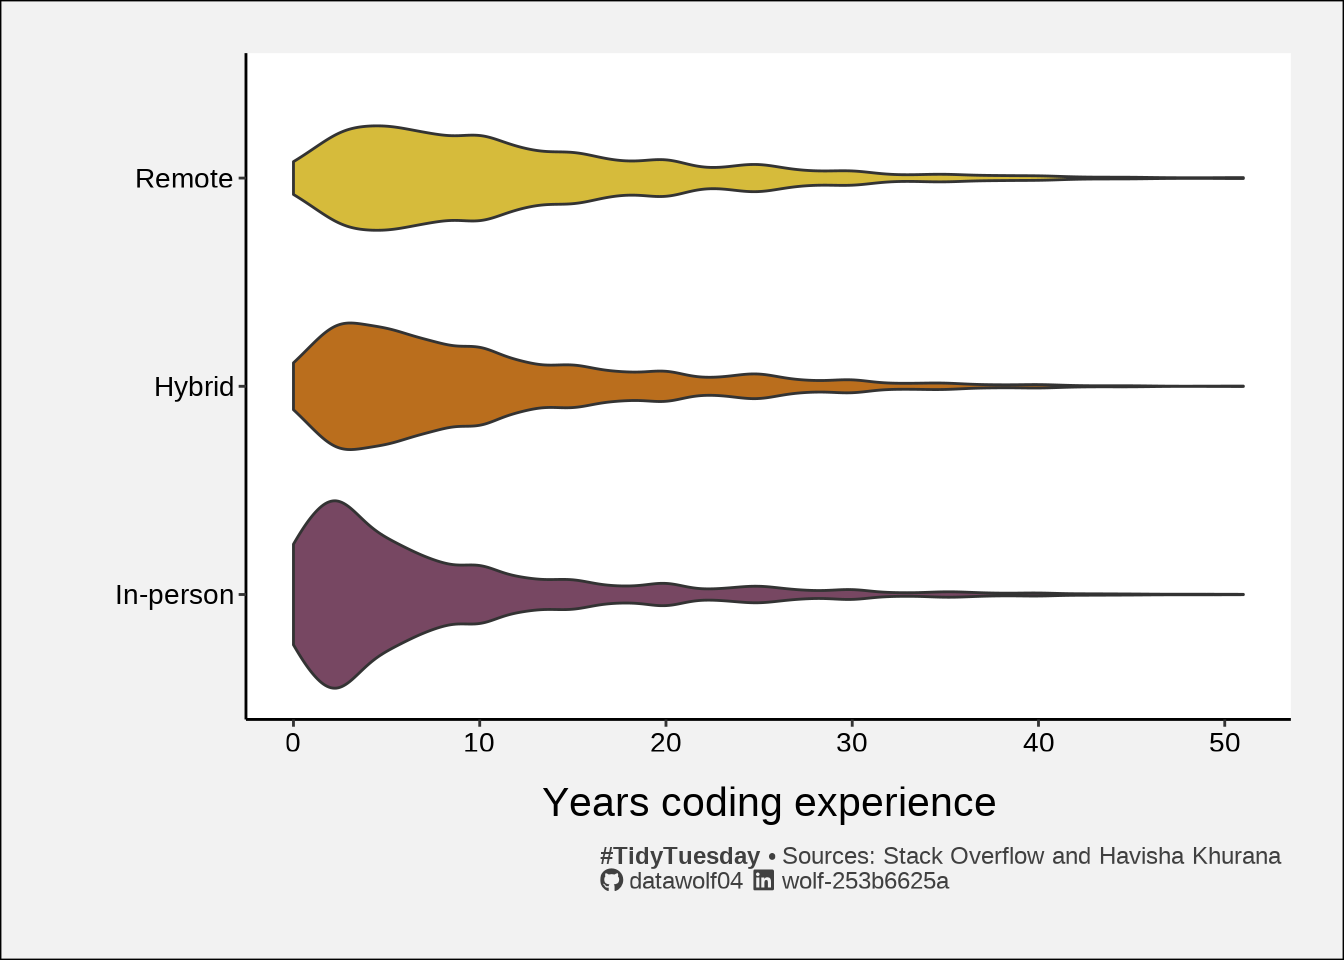
Here we see a possible echo of the college idea that I raised above. However, I see a few other things as well.
- There seems to be a significant shift that as people gain experience coding, they move from in-person roles to hybrid/remote roles.
- As you do something for a longer time, you tend to estimate more. All of the responses seem to favor numbers ending in 0 or 5, especially once you get past 10 years. So if someone has 22 years of experience, they will probably round down to 20, or up to 25, rather than stating 20 exactly.